7 Benchmarking analyses
In addition to identification of prominent marker genes in the integrated data, benchmarking included calculations of ARI coefficients, LISI scores kBET rates for integration across different donors by using benchmarking pipeline from scib-metrices (version 0.5.1) package. All the datasets were clustered well using the above method with refined resolution.
We used the python package called scib that uses scanpy to streamline the integration of single-cell datasets and evaluate the results. The package contains several modules for preprocessing an anndata object, running integration methods and evaluating the resulting using a number of metrics. For preprocessing, scib.preprocessing (or scib.pp) contains functions for normalising, scaling or batch-aware selection of highly variable genes. Functions for the integration methods are in scib.integration or for short scib.ig and metrics are under scib.metrics (or scib.me).
7.1 Installation
Install the latest release on PyPI. If you want to get more information, please refer to https://scib-metrics.readthedocs.io/en/stable/index.html
pip install scib-metrics7.2 Usage
7.2.1 Load and preprocess data
import numpy as np
import scanpy as sc
import scvi

from scib_metrics.benchmark import Benchmarker
%matplotlib inline
adata=sc.read('./data/DemoIntegrated/AT_integrated.h5ad')
adata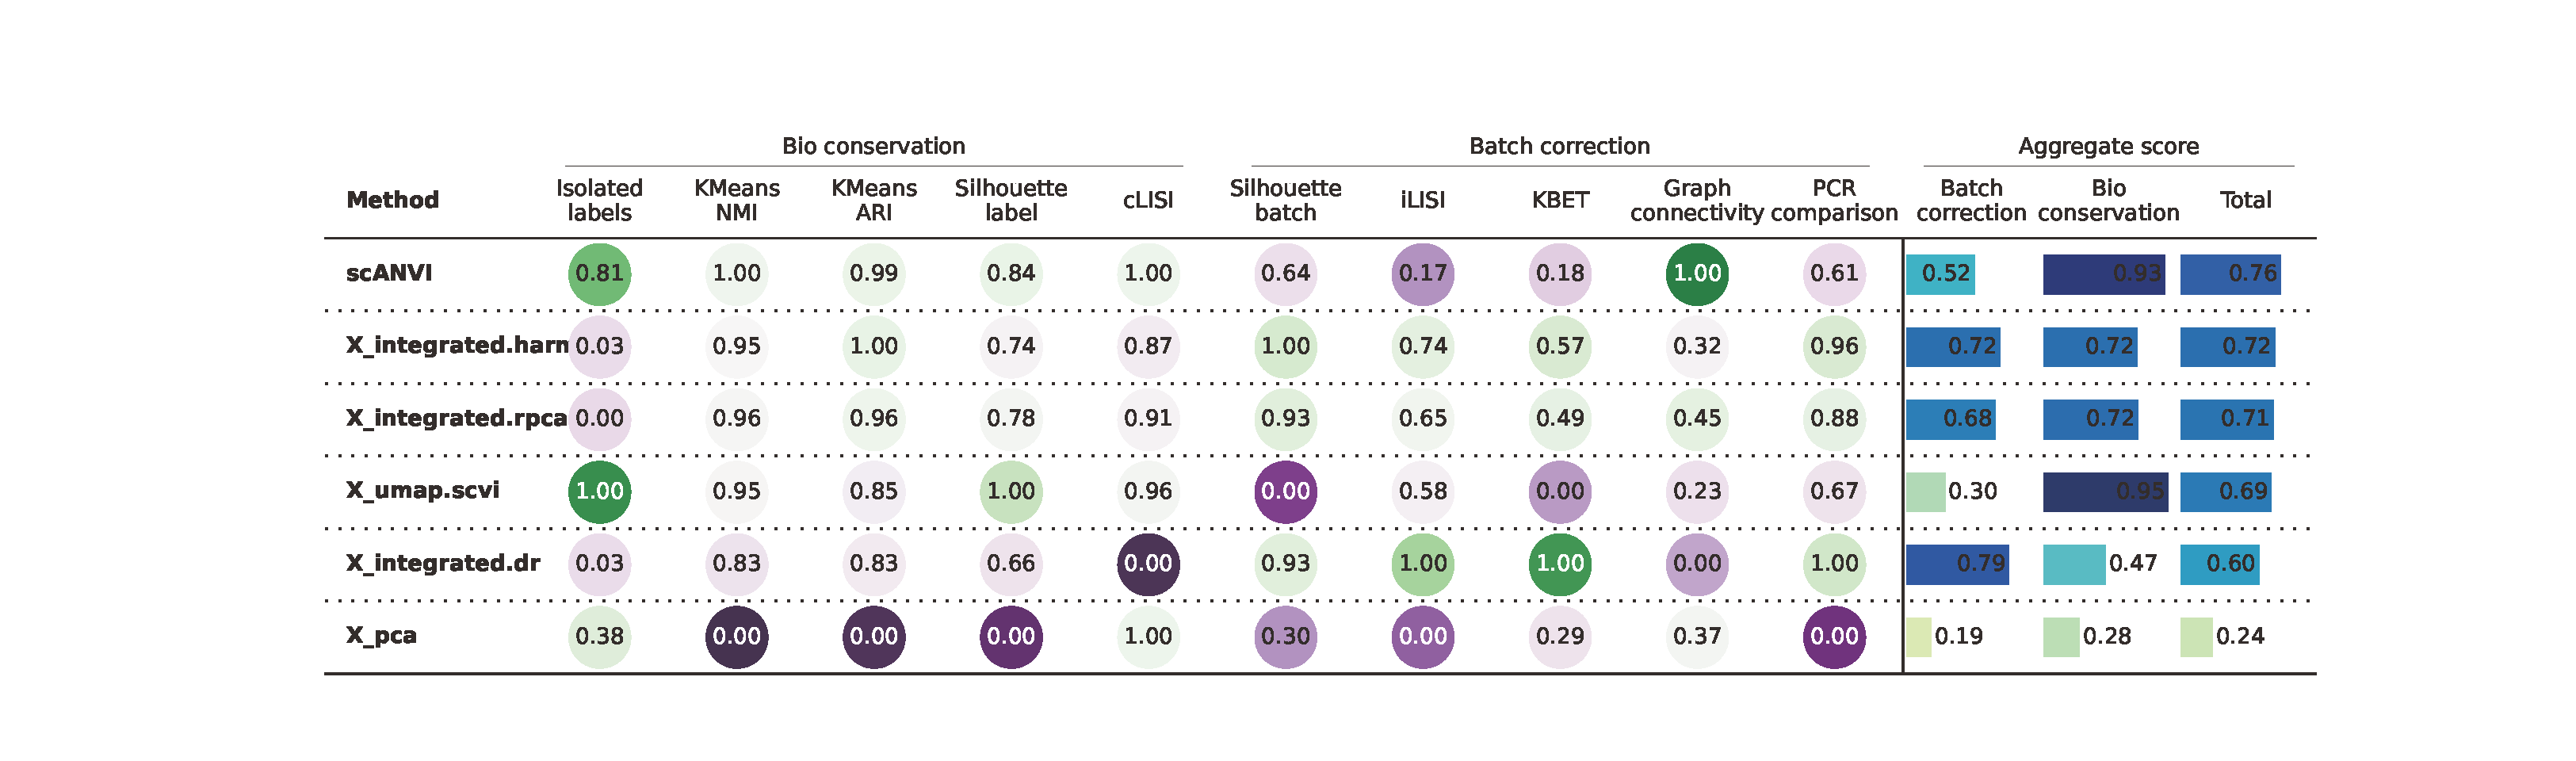
7.3 More information
If you want to get more information, please refer to the documentation and GitHub: https://scib-metrics.readthedocs.io/en/stable/index.html https://github.com/theislab/scib